Dropbox Developer Platform
As the Lead Product Designer on the CI Tools team, I accomplished the design of a developer tooling platform that streamlined engineering workflows. The fragmented experience of third-party tools presented an opportunity to create a unified solution tailored to Dropbox needs. The outcome was a more functional, visually coherent, and scalable experience that reduced time on task, led to a 60% decrease in support tickets, and achieved a 90% user satisfaction score. This translated into measurable gains in engineering efficiency for the business.
Problem
Based on the volume of complaints coming from engineers through a dedicated Slack feedback channel, 1:1 manager check-ins, and discovery user interviews, we became aware of pain points that slowed down the engineering workflow and impacted the business performance.
Objective
Improve the speed of development cycles by creating a unified platform that consolidates all dev tools. Make it flexible and scalable to accommodate for future functionality.
Establish an intuitive, consistent experience by enhancing information architecture, interactions and data display across tools and adhering to the Dropbox Design System.
My role
Shaped product strategy and prioritized features.
Conducted qualitative and quantitative user research and iterated on concepts and prototypes.
Validated solutions with engineering stakeholders and the design system team.
Delivered high-fidelity mockups and supported engineers through implementation.
Conducted pre-launch QA and classified defects.
Collaborators: Engineering leadership, Code Workflows engineering team
Understanding the current state
Personas and workflow
I defined 3 main personas and a high level developer workflow.


New Droplets
Engineers that started at Dropbox in the last few months.
AI / ML Devs
Engineers with a longer tenure at Dropbox that build with AI and ML.
API Devs
Engineers who design, build, and maintain APIs.
Project background: code testing flow
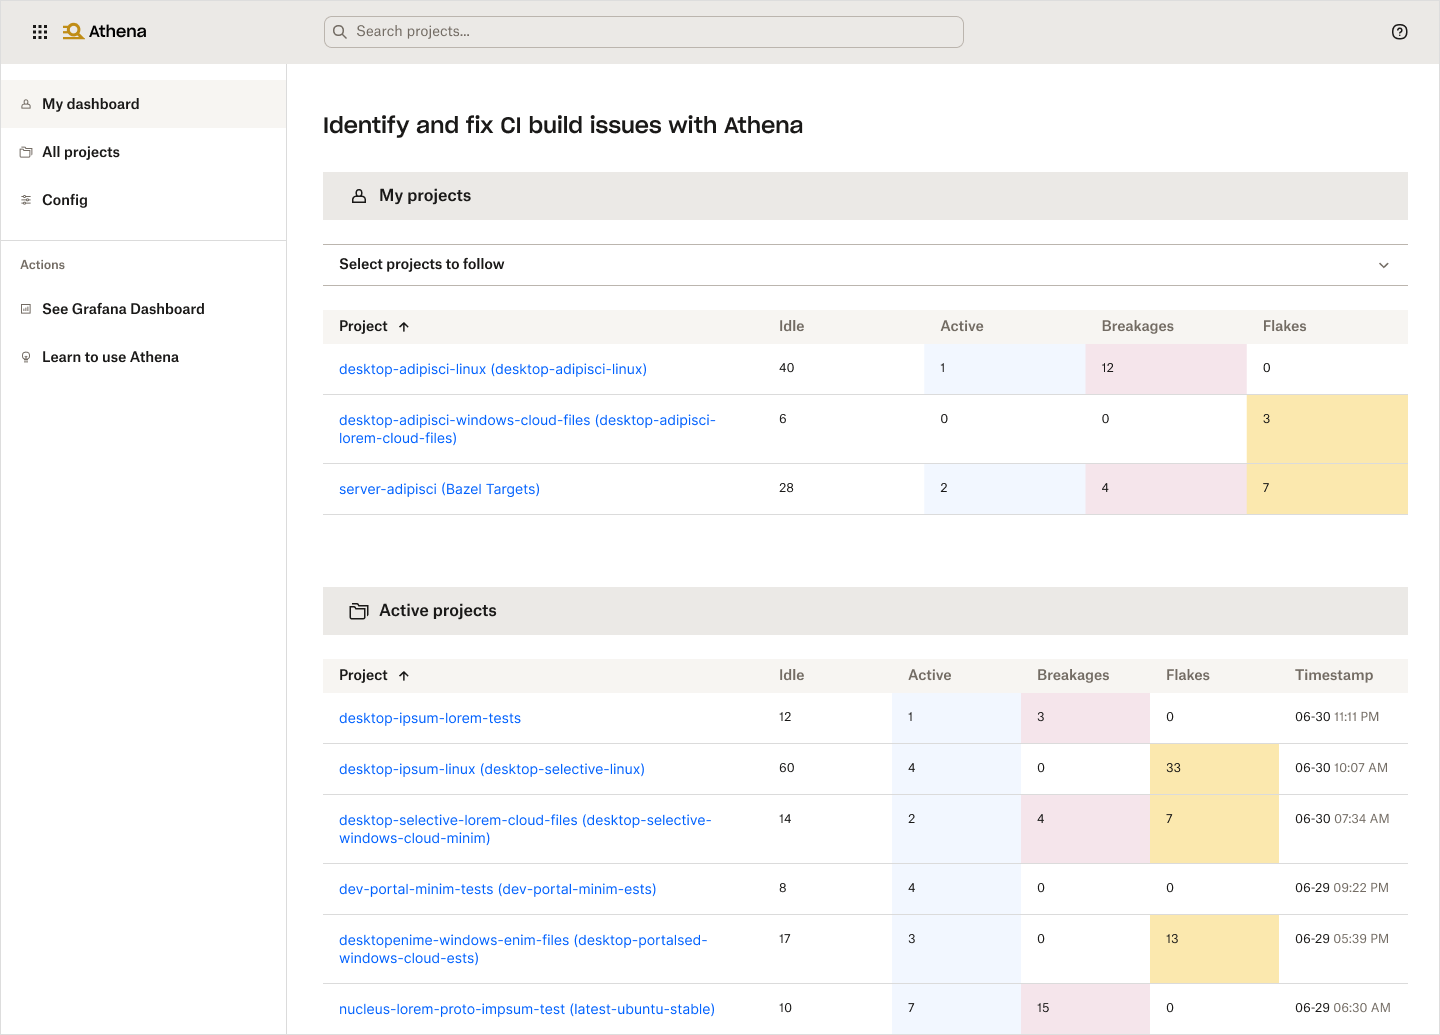
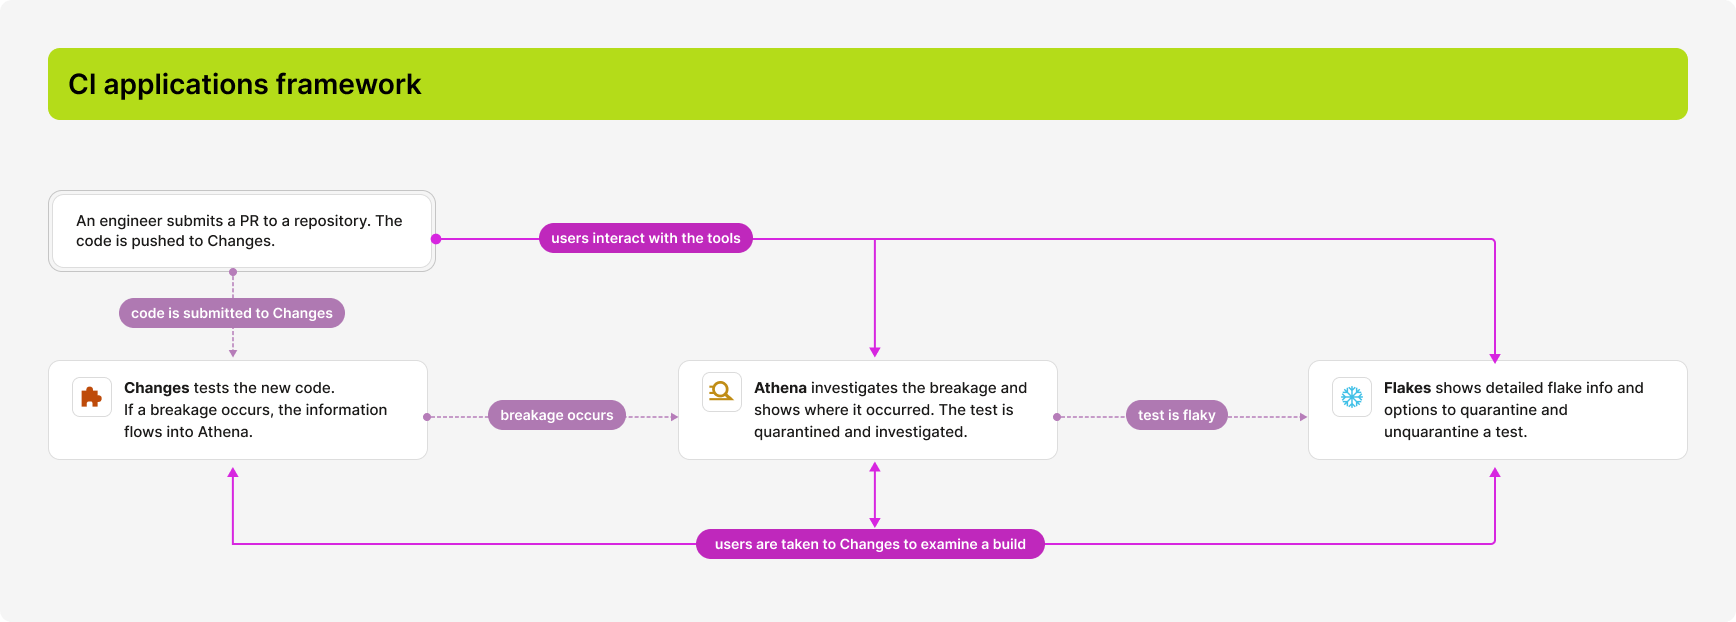
With a basic back-end framework already in place, I started by understanding how code is tested across the three applications (Changes, Athena, and Flakes) and identifying where developers needed to access results.

User feedback
When a breakage occurs, developers need immediate visibility into the issue, surfaced in Athena. When a test is flaky, that information surfaces in Flakes, which developers will need to access most often.
Platform framework and Flakes application design
Flakes was prioritized as the first deliverable given its central role in the engineering workflow. I approached the design with a platform mindset, establishing an information architecture and navigation model that could flex to meet each application's functional and data display requirements while maintaining a consistent structure across all of them.
Challenge
Design an app that will enable developers discover flaky test information and take action easily and quickly.
Requirements / Acceptance criteria
Platform level:
- Users can easily navigate between applications
- UX patterns and IA framework are consistent and scalableUsers can quickly check test status and access information:
- basic (quarantine days, Jira task) and
- detailed (historical runs, pass rate, build)Users can take action to unquarantine and quarantine a test.
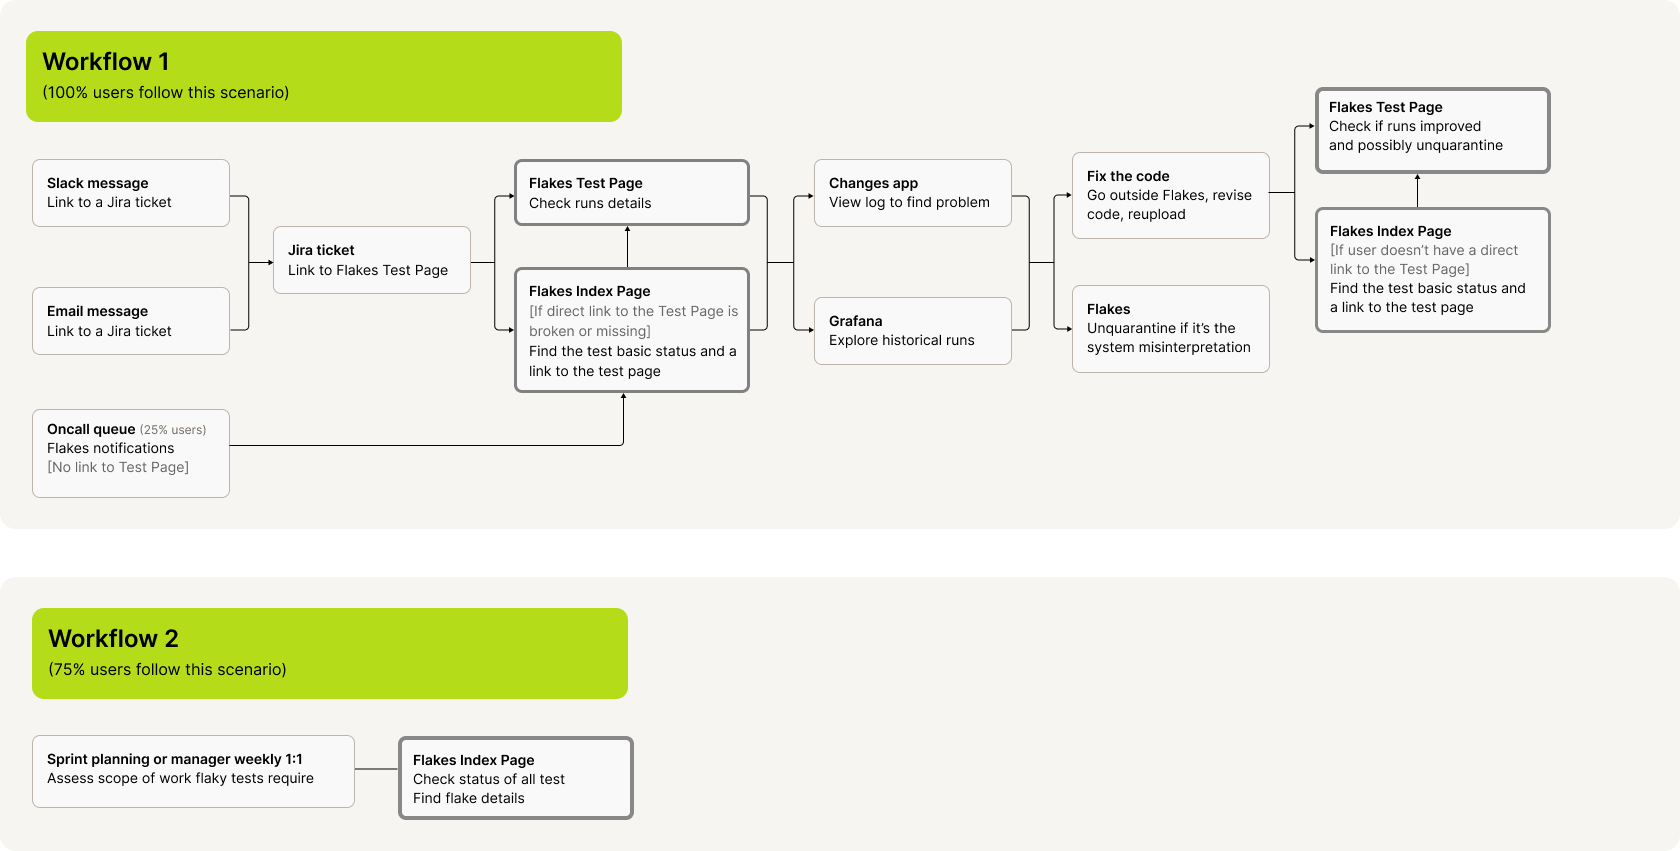
User task flow
I started with discovery interviews with developers to map out a typical day in their life. Based on it, I outlined entry points and key actions Flakes should support. I identified a need to create the main Index Page/Dashboard with enhanced findability and Test Detail Pages as the core touch points in the workflow.
MAIN DASHBOARD
Concepting
Platform level:
Designed a global header pattern with a flexible layout and search functionality to be implemented across the platform. Included an app switcher for easy navigation between applications. Assigned placement of secondary links, like help, in the right corner of the global header per web standards.
Created a global left nav dividing links into informational and action items to increase searchability and scalability, and to provide a fast access to actions.
Aligned design with the Dropbox Design System, extending it with new components where needed. Explored ways to help developers find test data faster by personalizing dashboard and index pages and sharpening the clarity of key interactions.
Flakes app:
Designed a unified search pattern that combined two search methods in a single field, giving developers a seamless way to switch between them.
Implemented Flakes specific left nav dividing links into informational and action items.
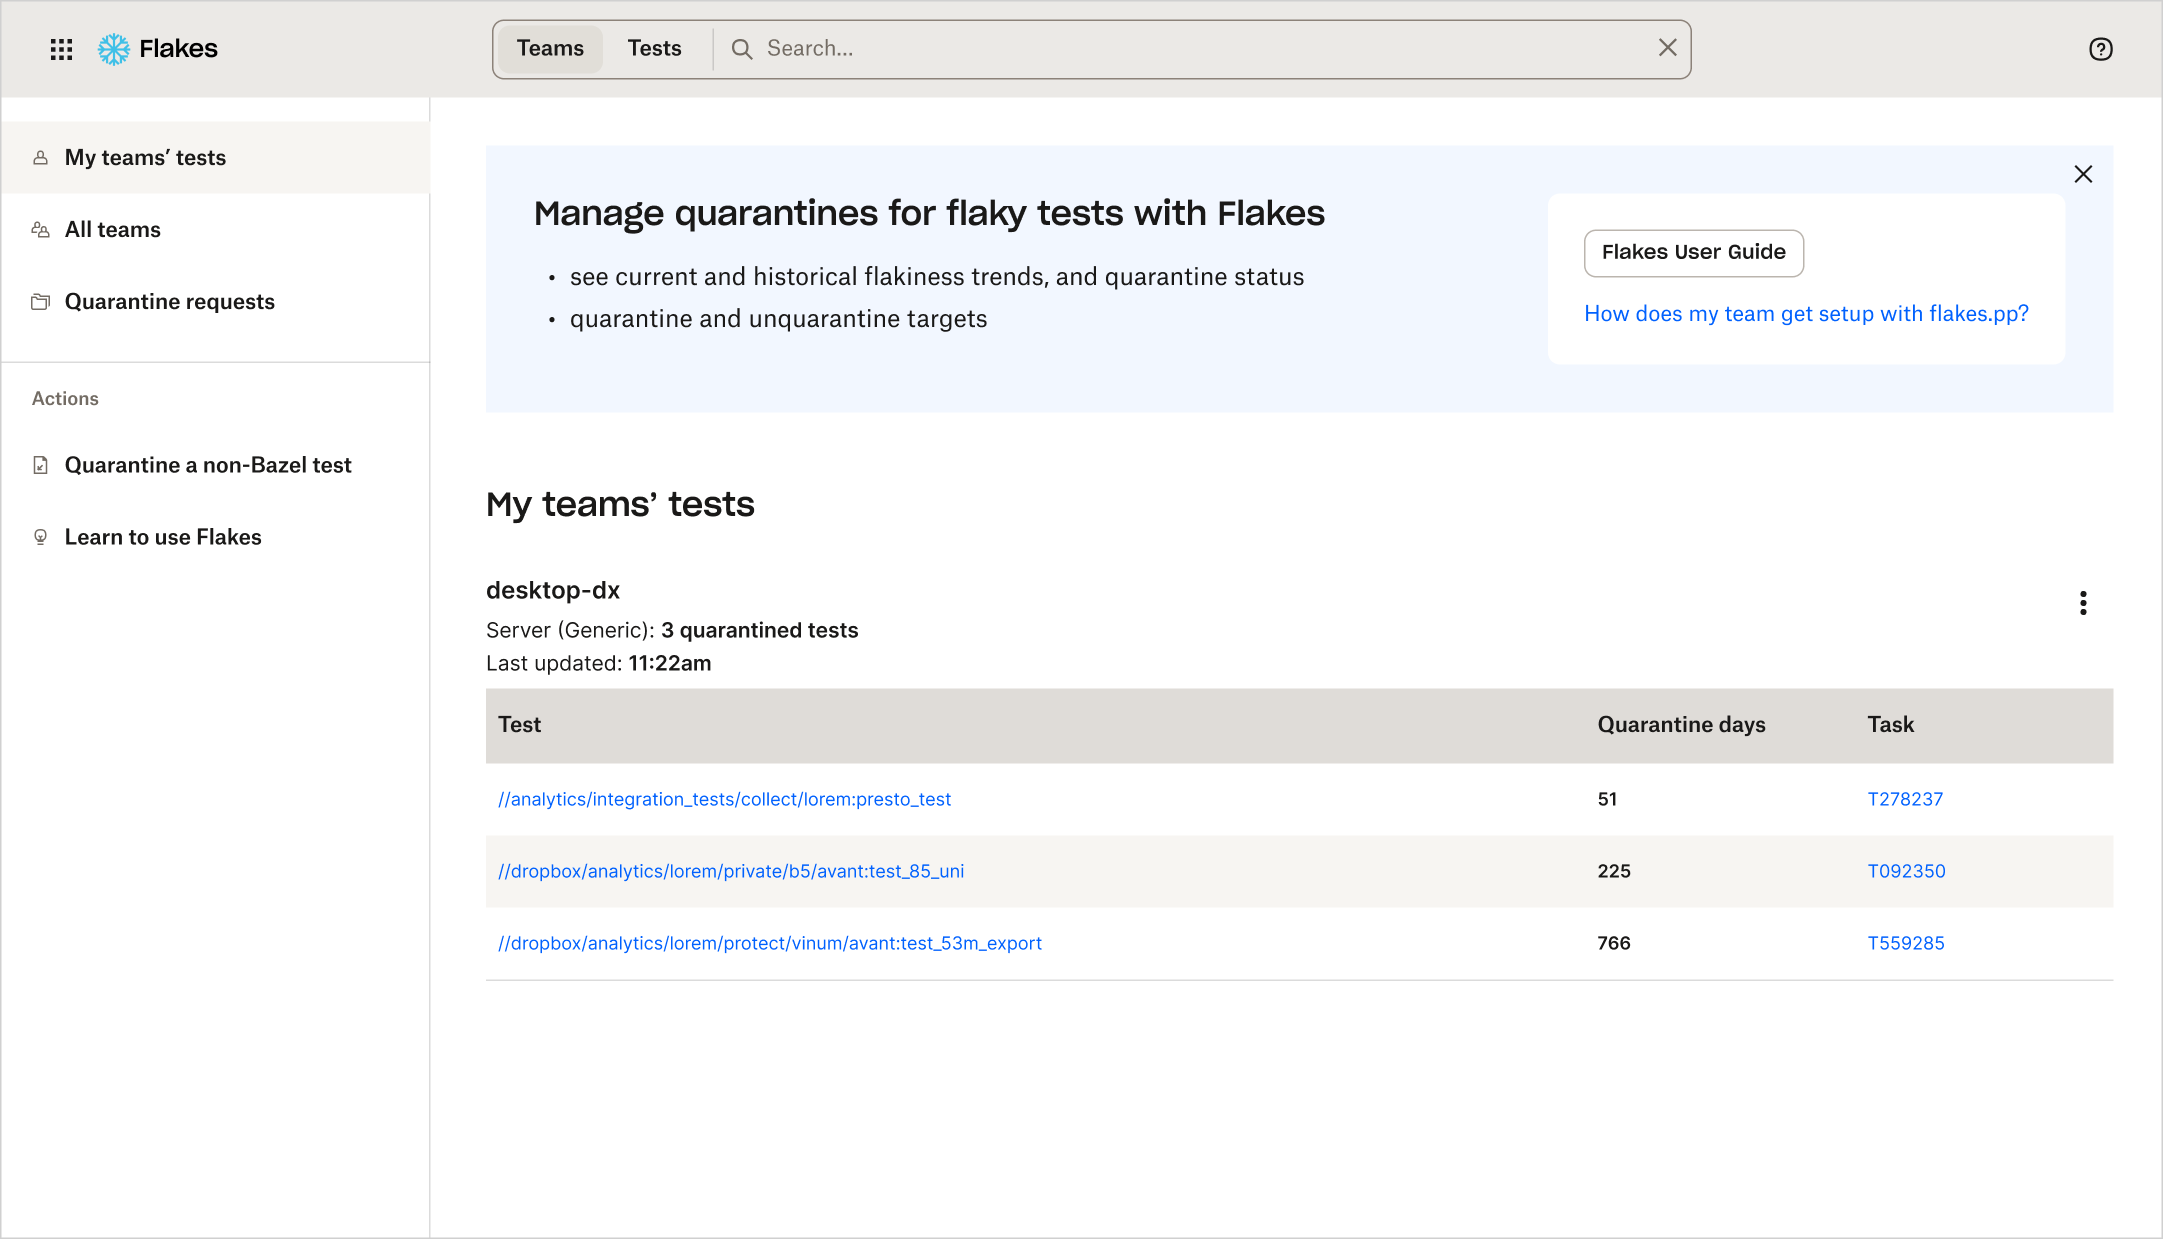
Based on detecting the user identity customized the index page to surface relevant information for each user type:
- First-time users saw a dismissible intro banner with links to learning resources
- All users got a dashboard listing their team's tests with key data: test details link, quarantine days, and a linked Jira ticket
Engineering feedback
• We may not always be able to detect what team the user belongs to and to show their team’s tests.
• Some users may want to see multiple teams’ tests.
Iterations
I addressed the additional requirements by giving users more control over which teams are displayed:
Added a team selection feature letting users choose and modify which teams appear on their home page.
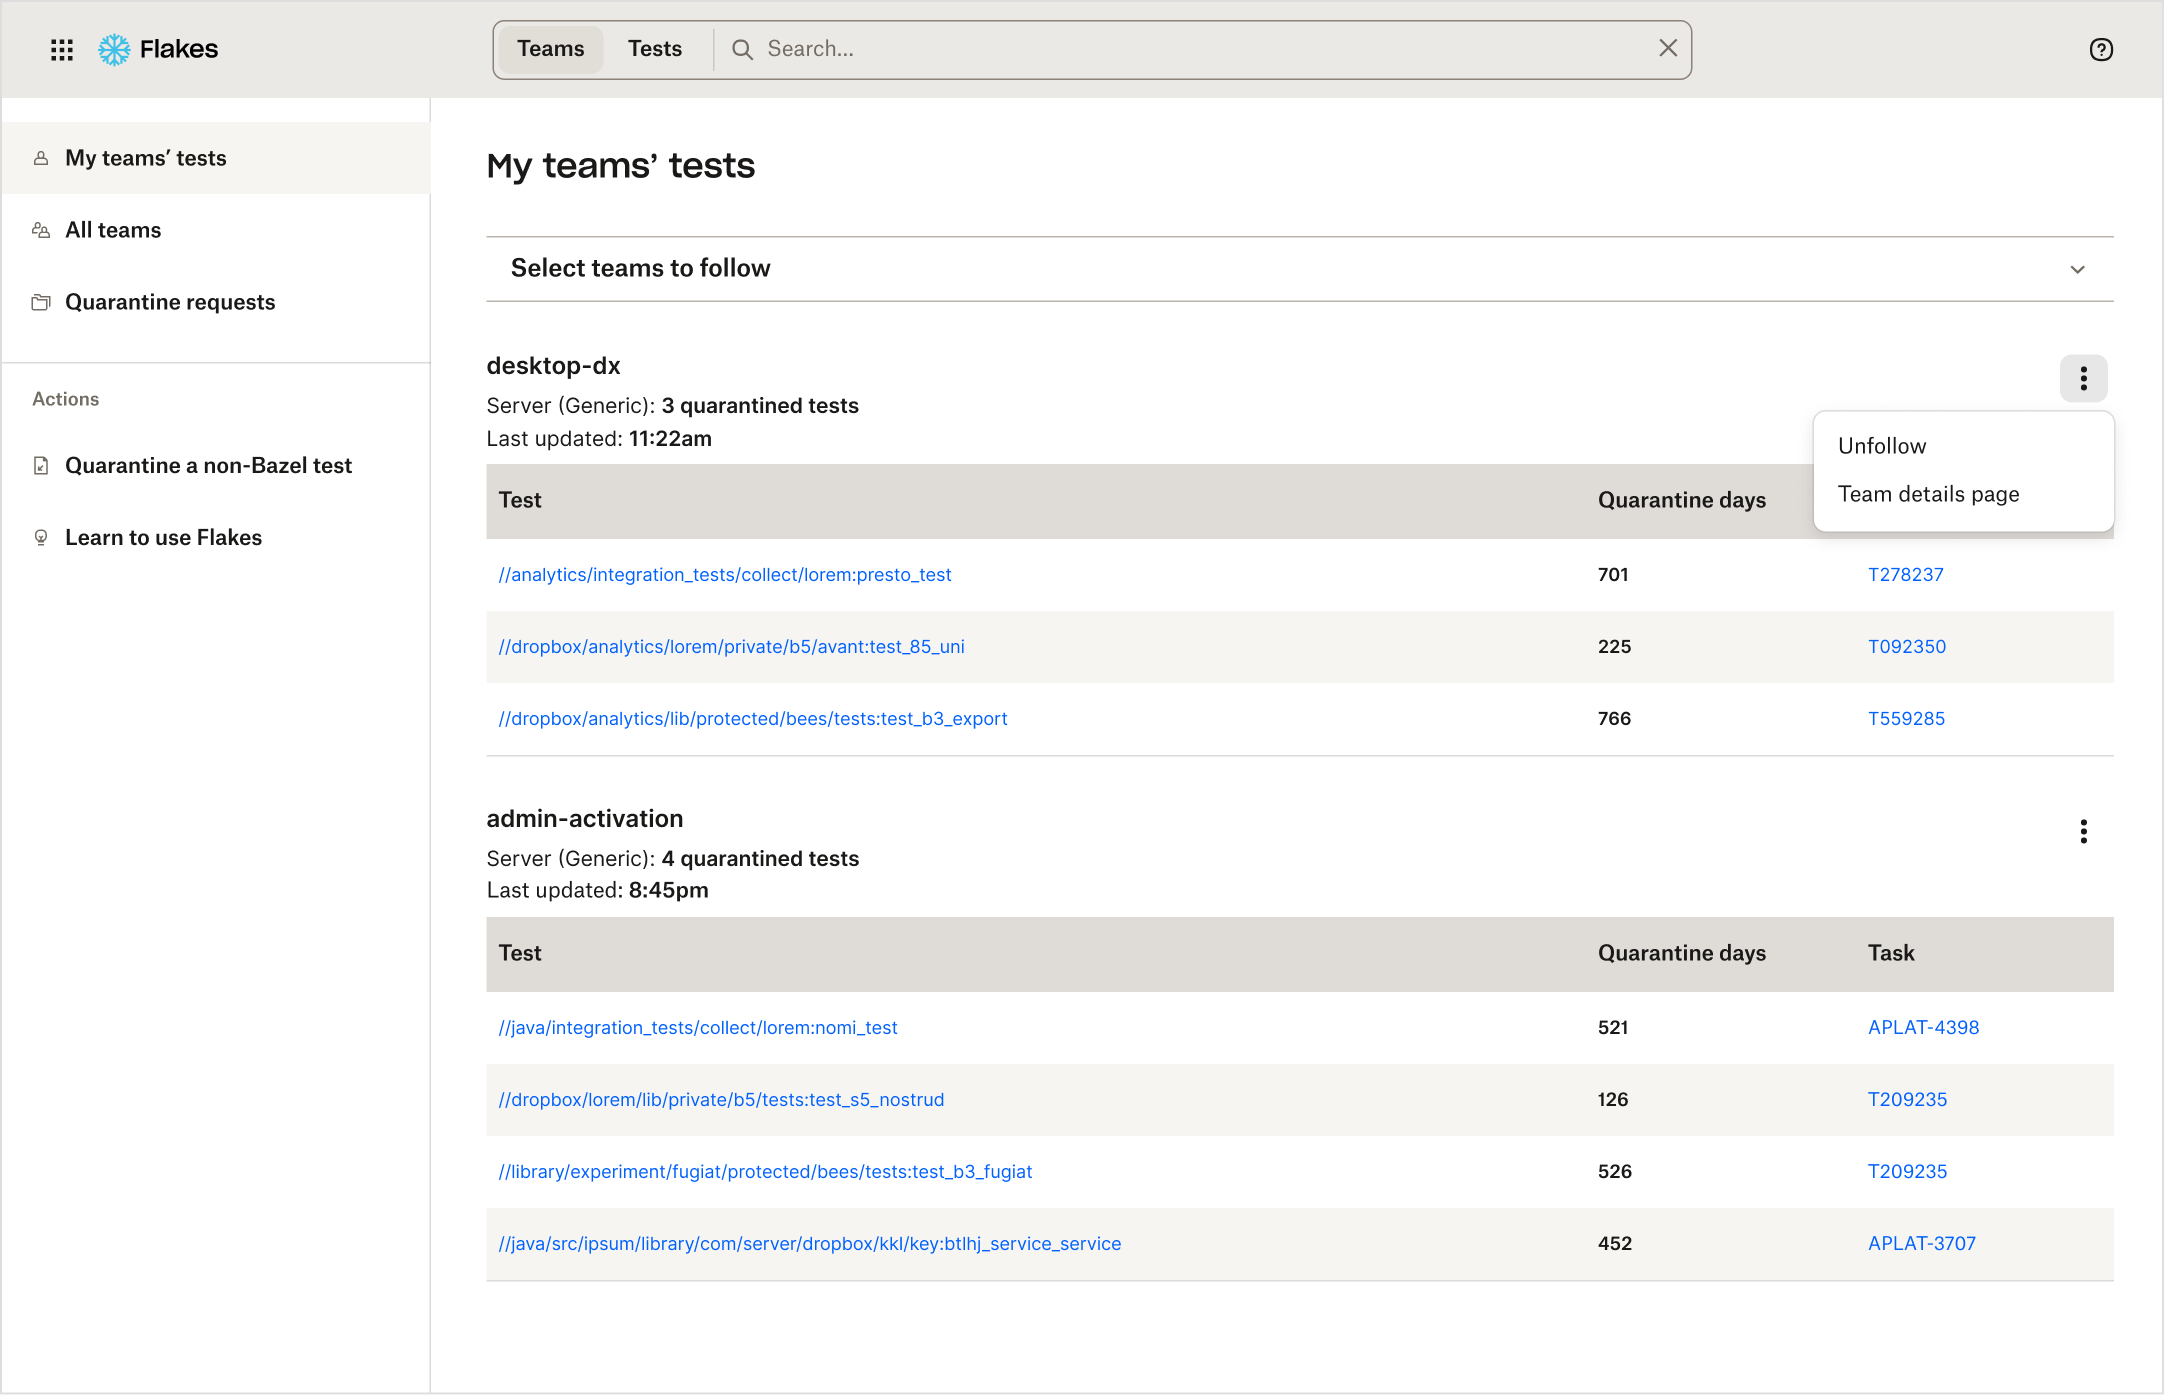
I introduced an option to unfollow the team in the ‘More” dropdown in the list header. If the list is reused on other pages where the team selection feature is not be available, the dropdown will still allow for a basic customization of the view.
I mocked up a multiple teams display option.
Scenario 1: We detected user’s team(s)
We display data about each user's team(s), tests, and Jira references. We still provide a team selection feature where users can modify the selection. Since this is a secondary action in context, its prominence is minimized, showing only a "Select your team" CTA and revealing the select field on demand via a down caret. To support contextual and scalable team management, I introduced an “Unfollow” action within the list-level menu.
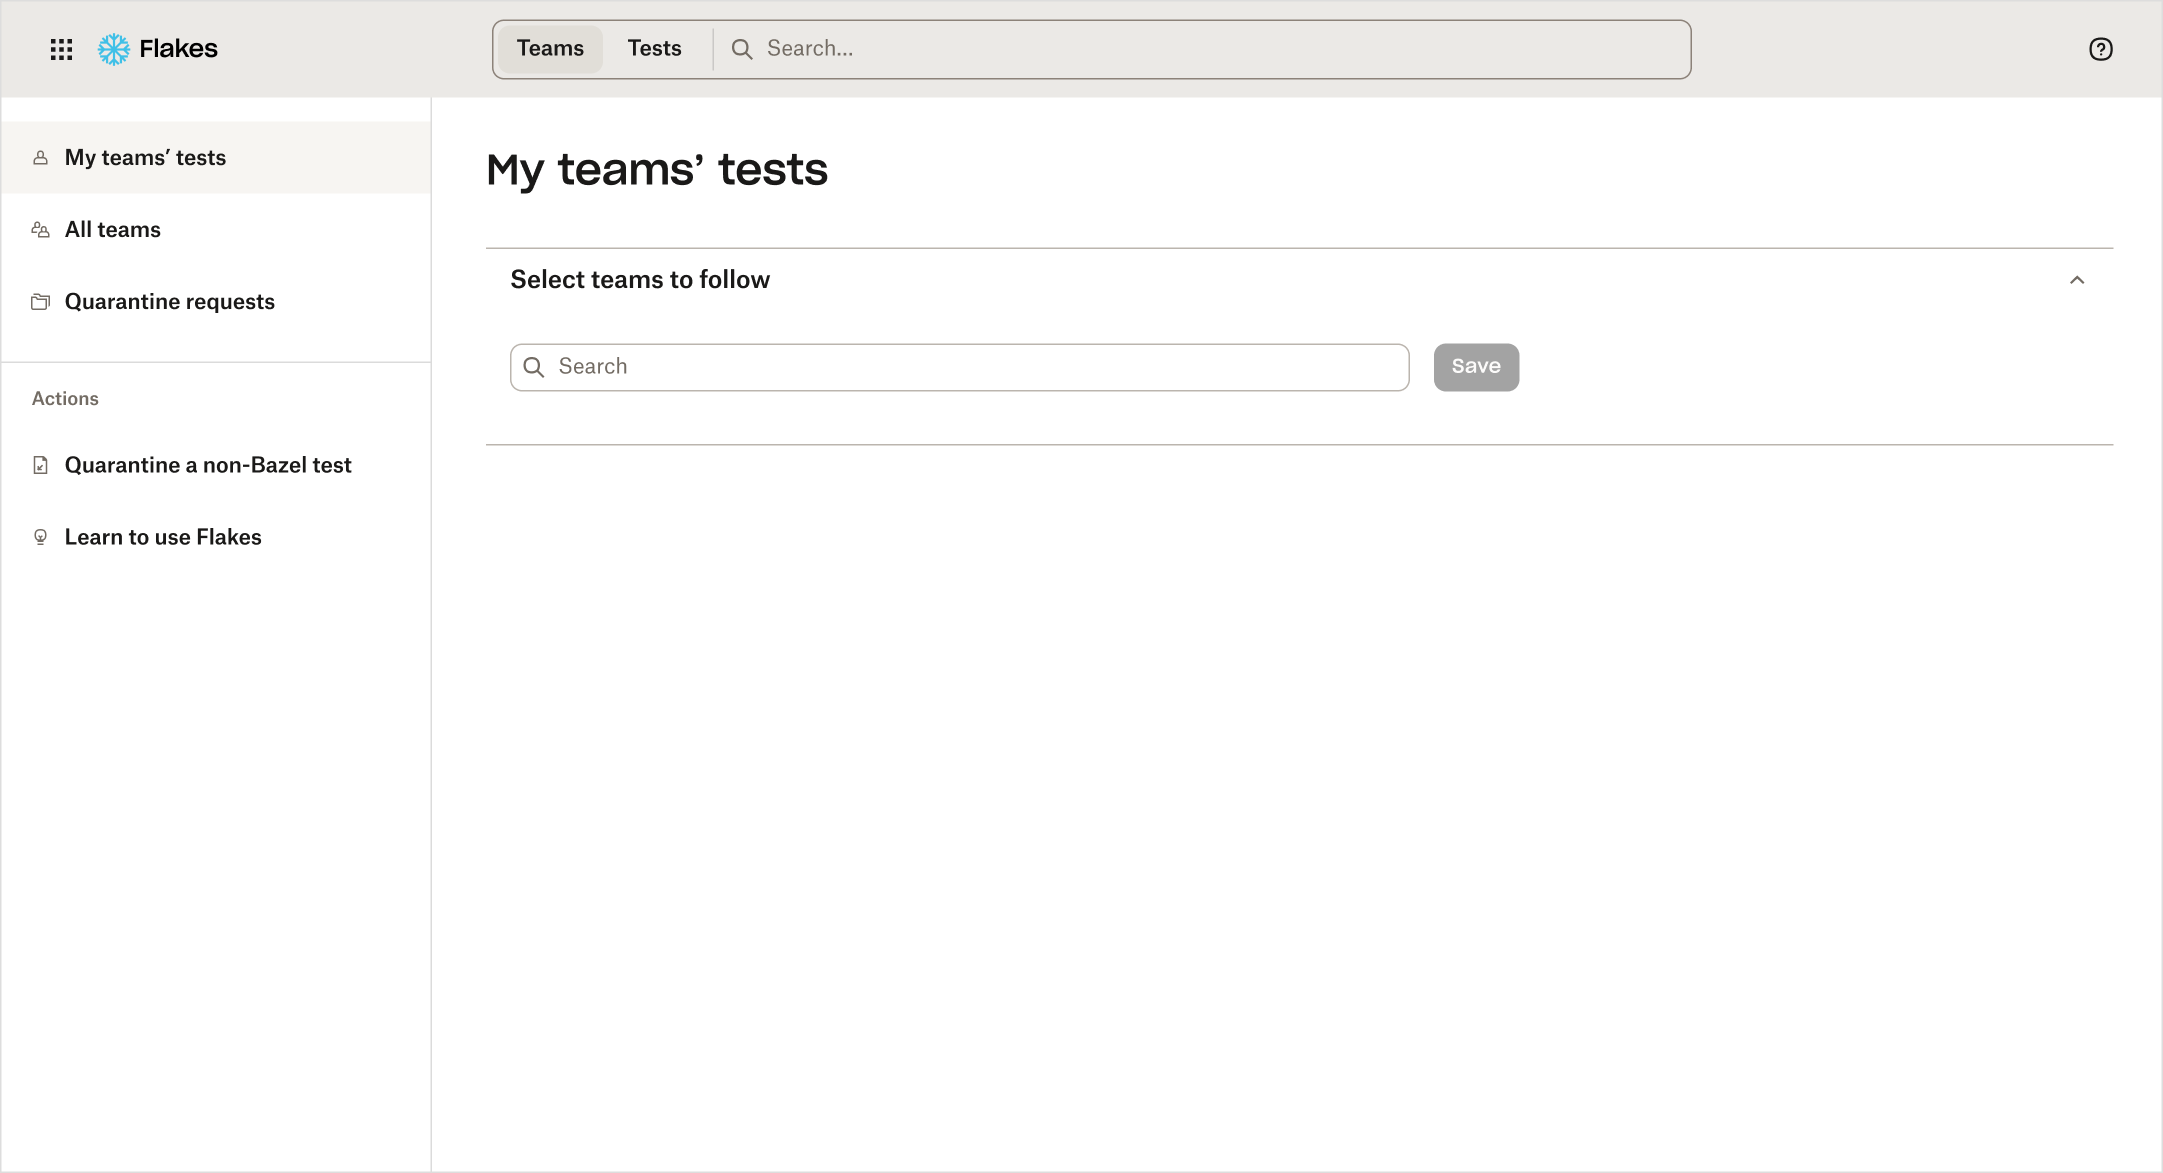
Scenario 2: We didn’t detect user’s team(s)
We can’t display their team(s). The team selection feature is more prominent and unfolded by default as it becomes the primary action on the page.
TEST DETAIL PAGE
Users will arrive at the test detail page after clicking on the test link on the HP with the intention of digging deeper into the test details. Based on interviews with engineers I defined essential data and actions that the page should give them access to.
Requirements
Display identifiers: test url that can be copied, owner, Jira task, quarantine status.
Provide access to check runs, pass rate and build logs.
Allow to quarantine or unquarantine a test.
Technical constraints
Data about the runs from cannot be pulled into Flakes. We can only link to it.
Solution
Through iterations guided by user validation and feedback, I arrived at an optimum solution given the technical constraints.
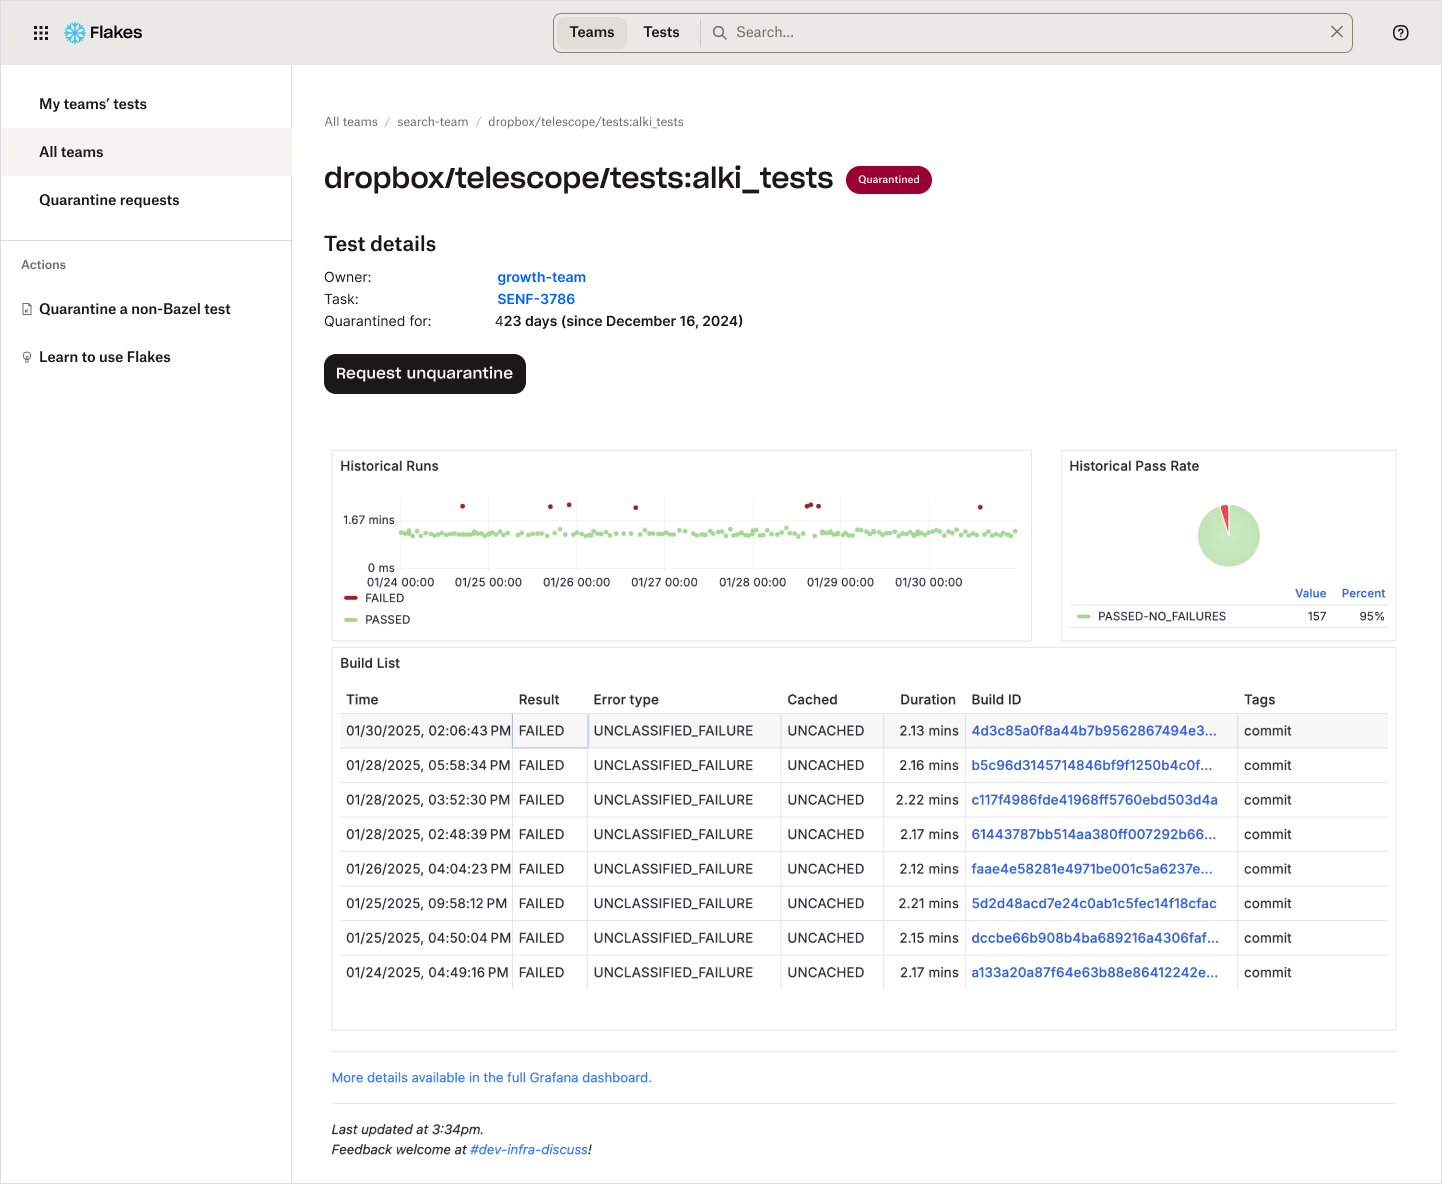
I grouped the identifiers and the quarantine action in one place at the top of the page. I emphasized the the test status with a color-coded status pill placed next to the test name.
I included the Quarantine/Unquaratine request button in the high-visibility section.
For exploring historical runs and pass rates we were able to pull basic data from third-party apps and display it in clickable iFrames. We presented build data in a dashboard with deep links to build logs in Changes. Given the technical constraints, we adopted this as the MVP and planned to address it with post-launch user research and possible further refinement.
Post launch user research
Goals
I wanted to learn if users can successfully accomplish essential tasks, discover the key drivers of friction, and get feedback on how useful the current features are and ideas for new ones. Insights from this research will inform the product strategy in addition to responding to user feedback via Slack.
Methodology
I guided 8 users through 15-minute sessions. I began with questions about how and when they use the product, followed by scripted tasks. I observed how they interacted with the tool, and where they got stuck. This led to an evaluation of the app, and a discussion of future ideas.
Metrics
Value for the user, Task completion rate, Time on task/ Error rate/Efficiency, and Satisfaction score.
Findings:
Flakes has high value and dependency for engineers. 100% used over the last month. 75% use on a weekly basis.
My team’s tests list and the “follow a team” feature were highly appreciated. 75% will use it at sprint planning, team weekly, or manager 1:1.
100% completed the task but 75% found it confusing at some point. Main friction was the Test Detail Page. Users found it hard to explore historical runs and pass rate pulled from Grafana. Build info is not surfaced in Flakes. It takes a long time to browse through logs.
50% of users rated the experience at 5 and the other 50% of users rated the experience at 4 on the scale 0-5.
The main reasons for the lower score was Test details page data access.Users particularly liked:
My team’s test and follow my team feature
Modern, clean look
Findability, overall ease of use
Results and next steps
User testing showed a 90% satisfaction score. In the post-launch weeks the volume of complaints and defect reports collected via Slack and the in-app feedback tool dropped by 60%.
The research confirmed that the primary issue impacting task performance was the difficulty accessing information on the test detail page. Drawing from engineers’ comments, I recommended including those improvements in the product roadmap:
Builds: Pull a summary from the log and surface it in Flakes, or provide a shortcut that takes the user directly to the failure in the log. Deep link to the thing that actually failed in Flakes.
Historical runs, pass rates: “Explore” buttons could open a larger container instead of being embedded in the tiny window.
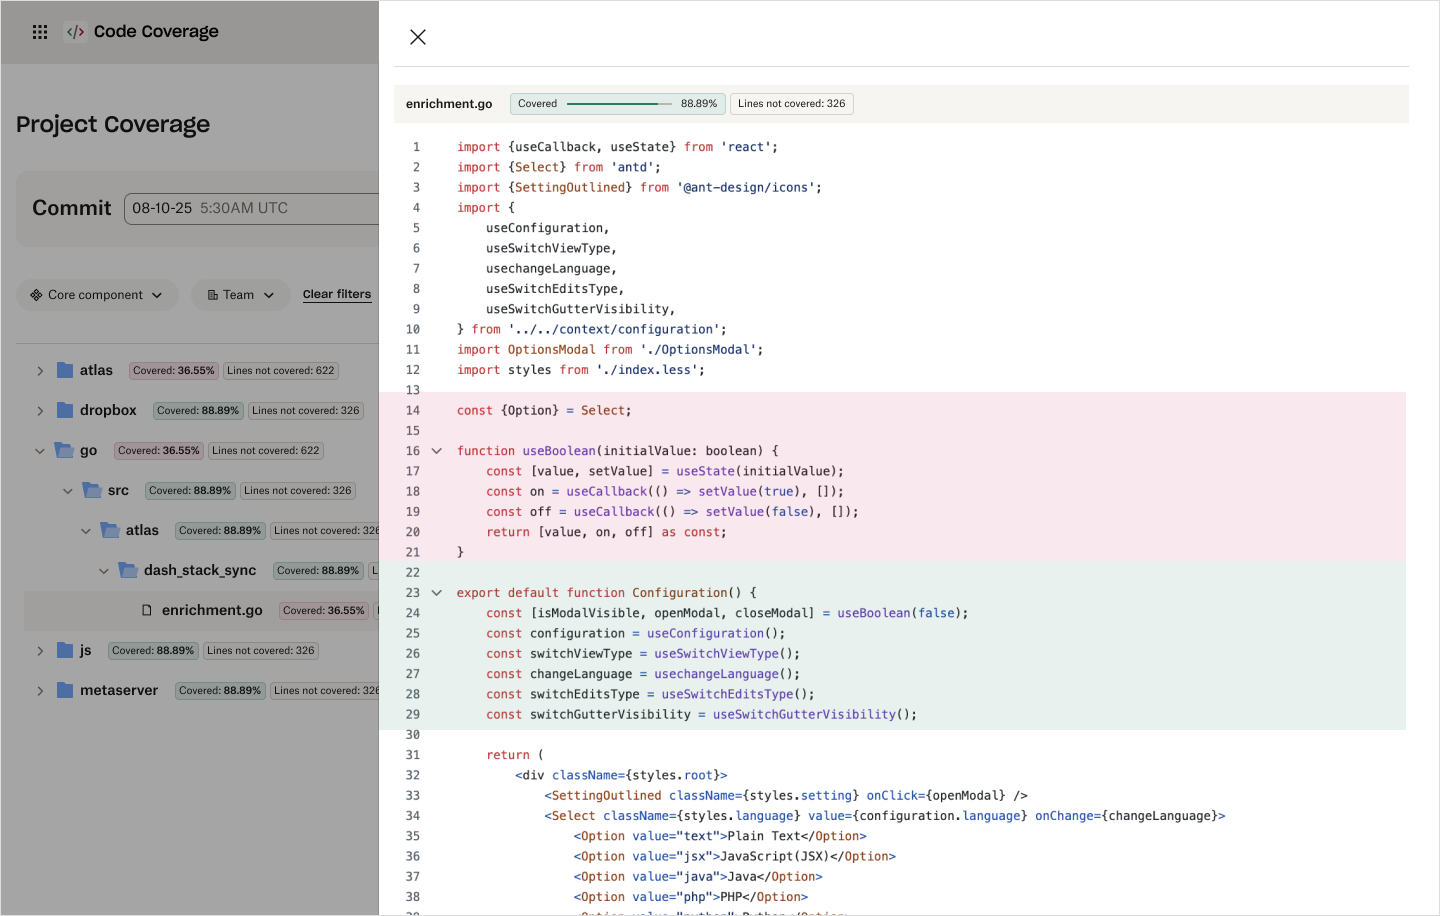
Athena and Code Coverage applications design
I proceeded to expand the developer platform and to connect and automate other key workflows, balancing design consistency and scalability with the unique UX each tool required. Athena and Code Coverage that followed steadily increased engineer satisfaction and resulted in faster delivery, higher-quality code, and greater time efficiency.